
Progress charts
Progressive overload tracking: best weight, 1RM, volume and reps
The Progress tab turns your log into charts you can read at a glance: a headline number, how much it changed over the range, and a clean line under it. Three views cover your whole training: Workouts for volume, Exercises for every lift you track, and Body for weight and body fat.
Last updated

7-day free trial, then €6.99 once · No subscription
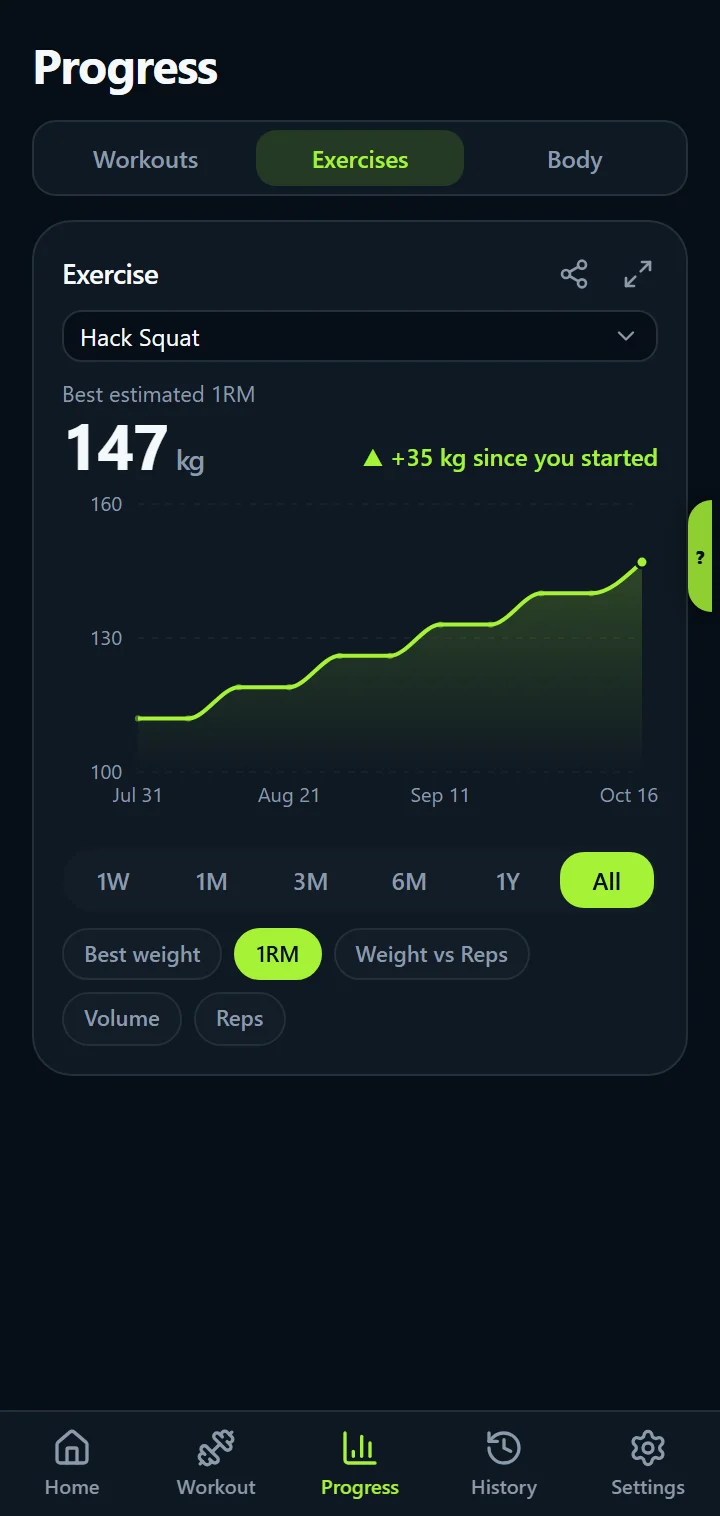
Five charts for every exercise
Pick any exercise you have logged and switch between Best weight, 1RM, Weight vs Reps (two lines on one chart), Volume and Reps. The headline says where you are now and how far you have come: “105 kg, ▲ +25 kg since you started”.
The estimated 1RM uses the Epley formula on the best set of each workout, so it moves when you lift heavier or get more reps at the same weight. Read how to track progressive overload for a simple weekly routine built around these charts.
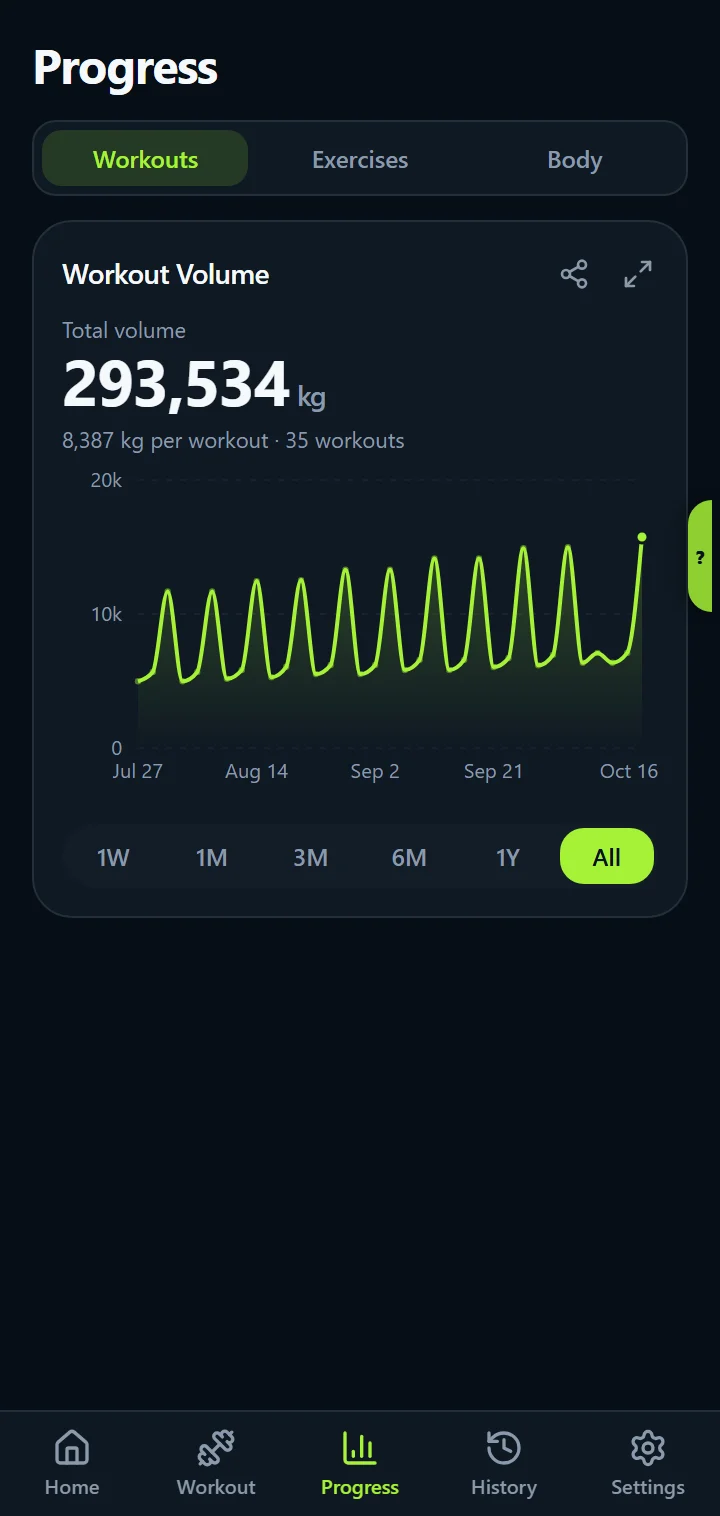
Training volume over time
The Workouts view charts your total volume (sets × reps × weight) per session and the average per workout. A dip after a deload or a holiday, a climb when your split starts working: the whole story of your training in one line.
Every chart has a share icon (full version) and a full-screen button in its title row, and one even time-range bar under it: 1W · 1M · 3M · 6M · 1Y · All.
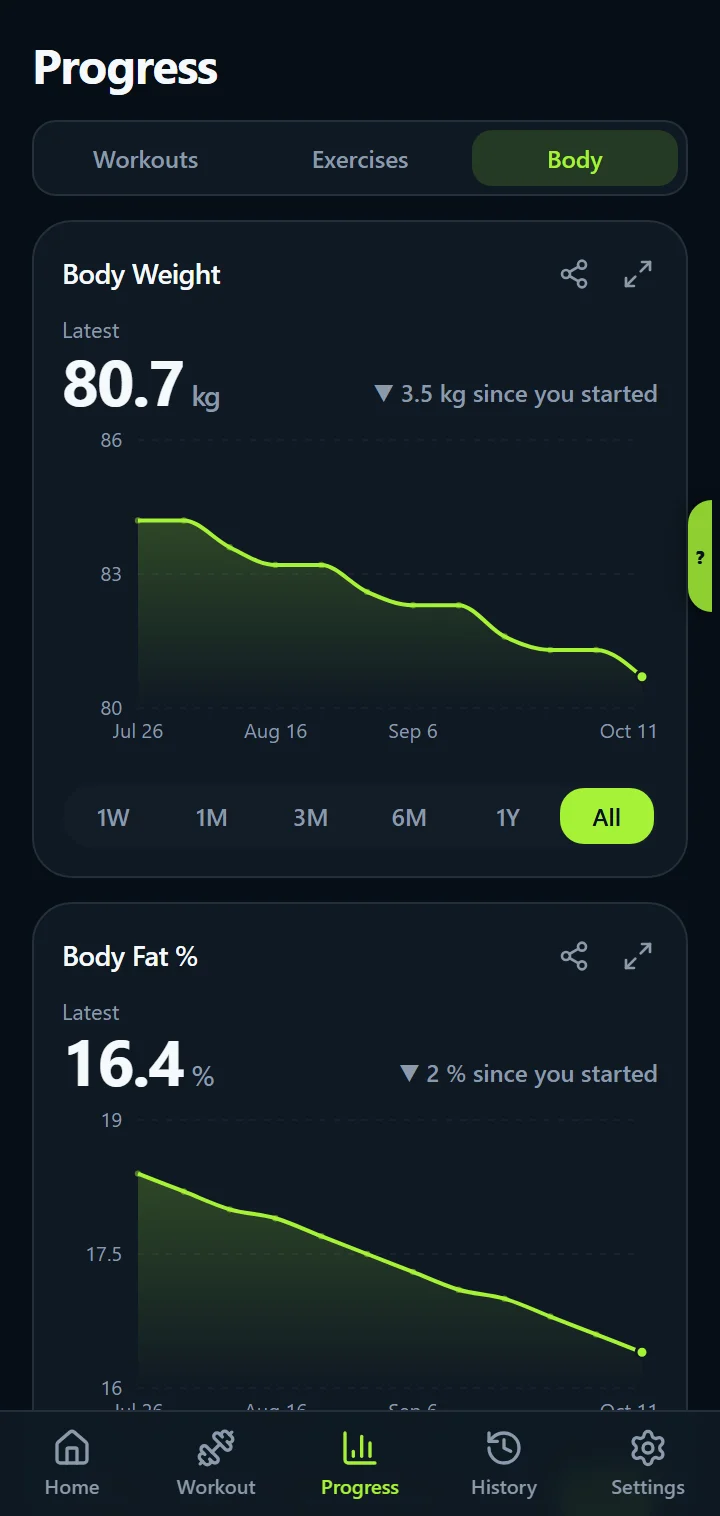
Body weight and body fat
Log your body weight and body fat percentage in Settings whenever you want, and the Body view charts both over the same ranges as your lifts. The Home widget shows your latest weight and its trend. Both are optional: track what is useful to you and nothing else.
Records, Home widgets and the exercise page
- Records: every exercise keeps its heaviest weight, most reps in a set, best session volume and best estimated 1RM, with dates. See the workout summary.
- Exercise chart widget: Home shows the best-weight trend of one exercise at a glance; in the full version you can add a widget for every exercise you care about and make it as big as you like. See Customizable Home.
- Exercise page: your last workout as a table (sets grouped by weight, best set, estimated 1RM) and your records, under the form demo.
- Full screen: any chart, as big as your phone, in either orientation.
Everything is computed on your phone from your own log. There is no account and nothing is uploaded, so the charts work offline like the rest of the app.
Progress chart questions
How is the 1RM calculated?
With the Epley formula, weight × (1 + reps ÷ 30), applied to the best set of each workout. Sets of more than 12 reps are counted as 12, where the formula stops being reliable. It is an estimate for tracking your trend, not a measured max: don't attempt a heavy single because a chart says you can.
How far back do the charts go?
As far as your log. Pick 1W, 1M, 3M, 6M, 1Y or All under any chart. With months or years of history the sessions are grouped into weeks or months so the line stays readable, and the headline number always shows the change over the range you picked.
Where do body weight and body fat come from?
From entries you log yourself in Settings → Body Tracking, whenever you like. Both are optional. They are charted on the Body tab over the same time ranges as your training.
Get IronBuddy on Google Play
Free to download with a 7-day free trial. After the trial, pay €6.99 once to keep it all unlocked. No account, no ads, no subscription.